This is an English translation of the article by Igor Torba and Sergiy Grechukha published in the Ukrainian Developers Community.
Some time ago we faced a challenge of creating a comprehensive test coverage report for all unit and instrumentation tests (android-tests) run within the project. While setting up separate coverage reports for unit and instrumentation testing is a no brainer at all, creating a unified report is an issue that requires out-of-the-box approaches. We came up with a non-trivial solution that I'm going to describe in this article.
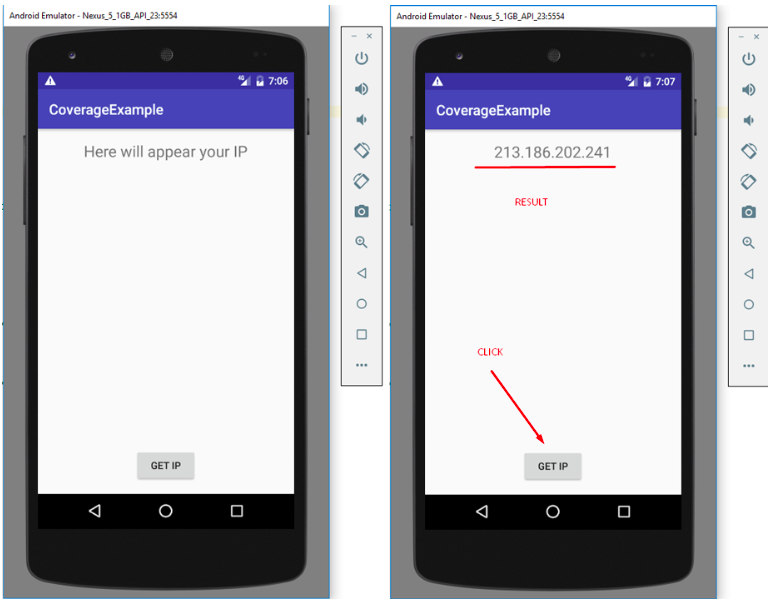
To better exemplify the case, we created a basic Android app which purpose is to make a REST request with a button click, receive our IP address in response and show it on the screen.
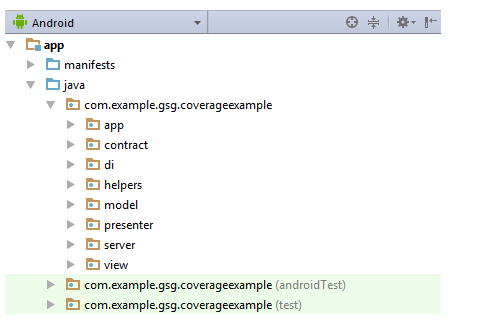
To simplify testing, we used the model - view - presenter (MVP) pattern and Dependency Injection (DI) with Dagger 2 in our application. The project layout looks as follows:
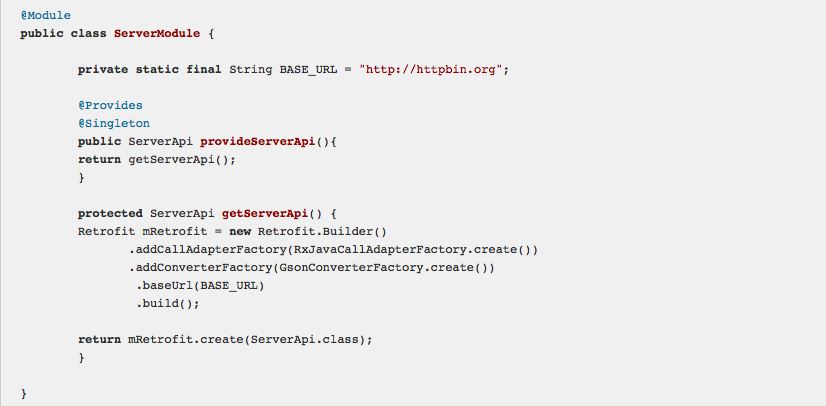
REST API design was implemented with RX + Retrofit2 (surprise, surprise!); DI was deployed on Server API so that we can easier replace it in UI tests down the road.
So whenever user clicks on "GET IP" button, our activity uses a presenter method to execute the request.
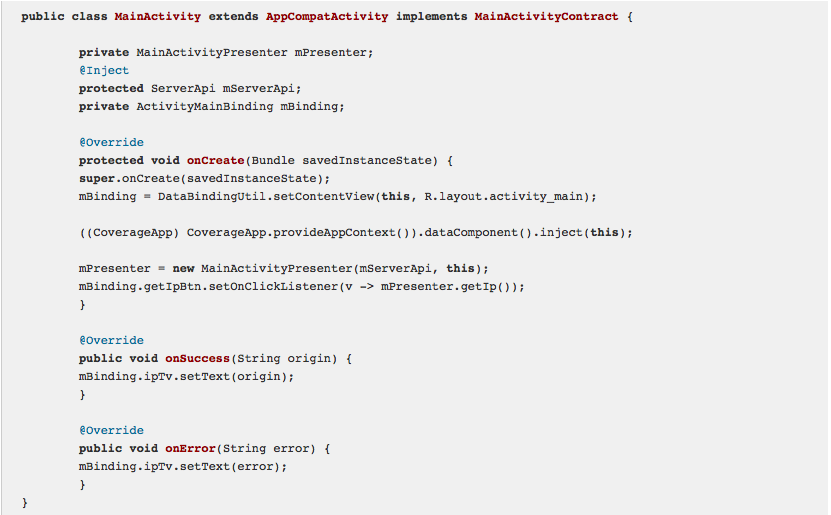
When presenter has a response, it calls respective callback methods.
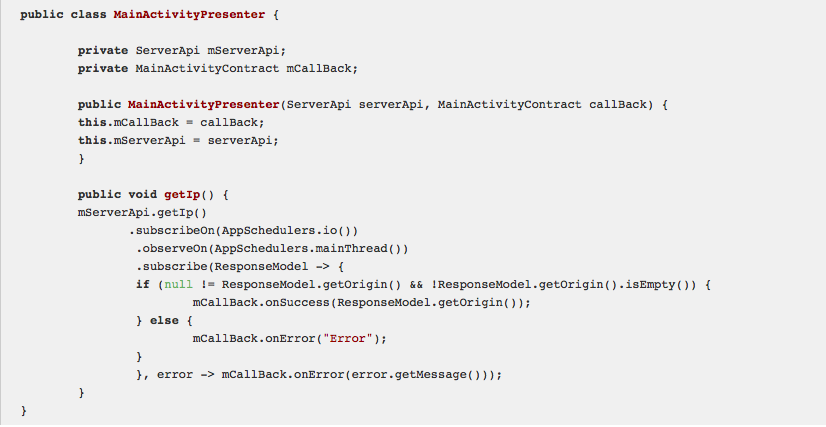
At this point, pay your attention to custom CSS class AppSchedulers that we used for RX. Its purpose is to overlap asynchronous streams with synchronous streams during a testing process.
Creating test cases
Now it's time for testing. Just for a better example, we created several tests:
- Unit test;
- UI Espresso test;
- Robolectric test
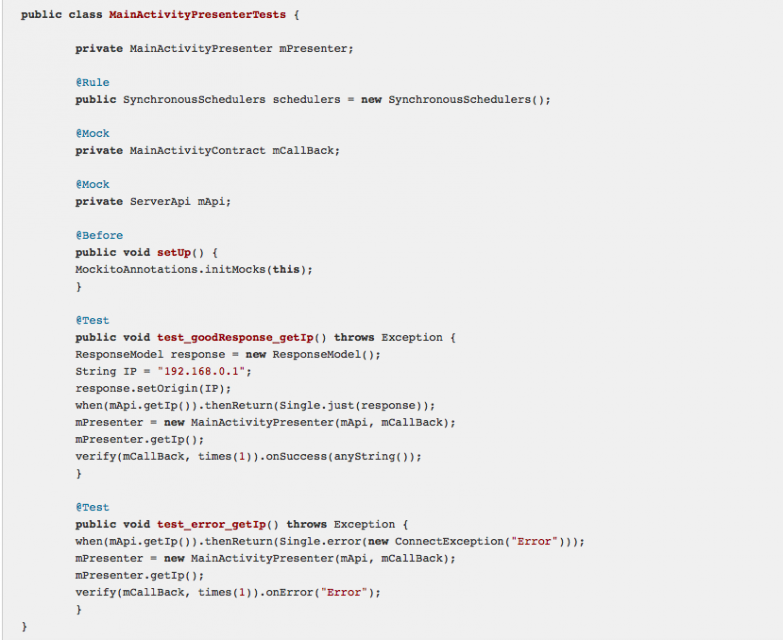
Unit Test
We used Mockito for creating mock objects:
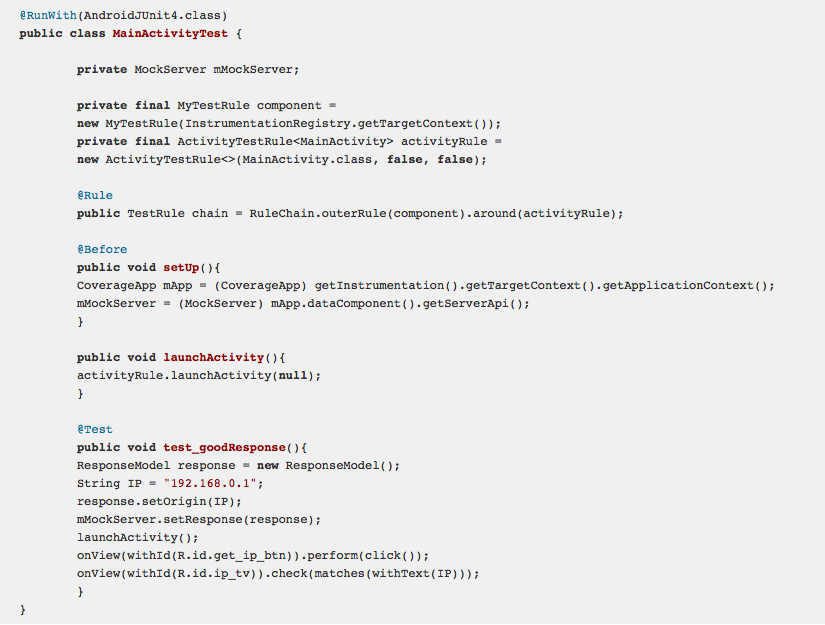
UI Espresso Test
Here we use a custom rule to substitute dataComponent for MockServerApi that will emulate our Server and its responses.
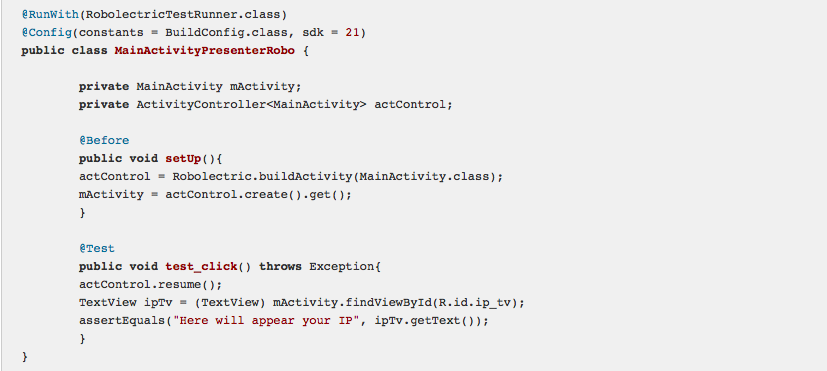
Robolectric test
We ran this test just as a tick-off and in order to include this test type to the project; in fact, it doesn't provide any value to our testing!
Measuring test coverage
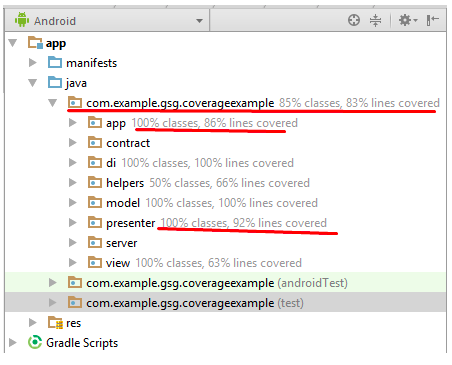
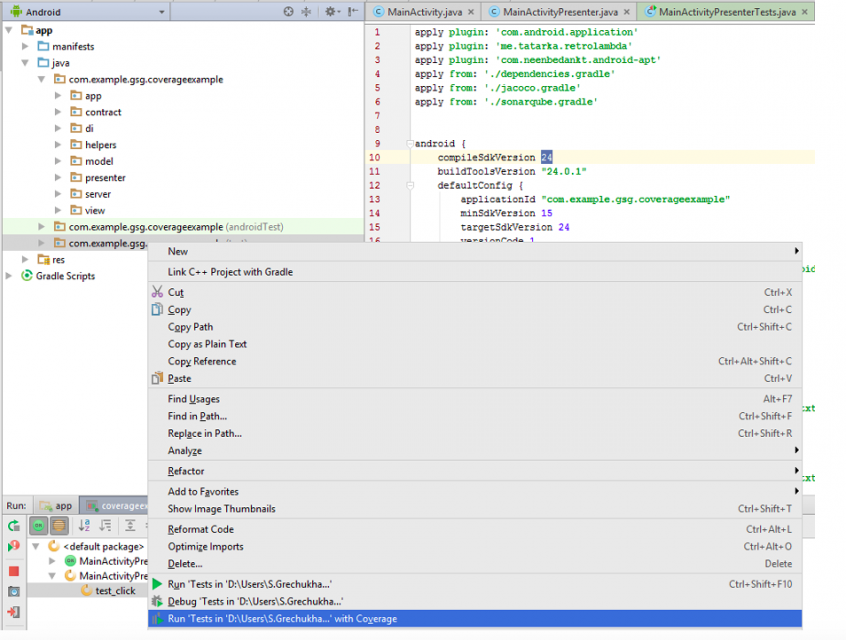
Now when we have all these tests put in place, we can move on to measure test coverage. As mentioned above, there's no Green Button when it comes to a unified test coverage report. In order to create a unified report, go to you Unit tests and run them all with coverage.
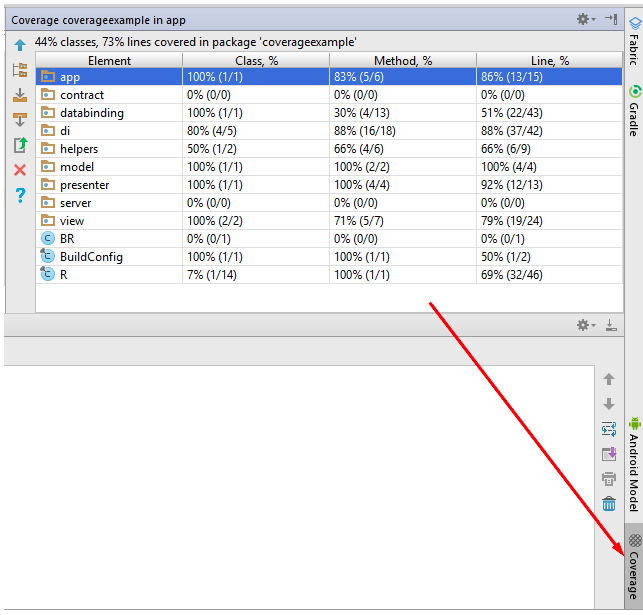
After all tests have been run you'll be able to see a coverage report:
Android-Test Coverage Report
Now let's generate Android-Test Coverage Report. For this purpose we had to "fine-tune" our gradle file (I'll show you later how) prior to moving to gradle tab in Android Studio:
- find createDebugCoverageTest task;
- double click;
- wait for all tests to run
Note: you should have your test emulator launched or an Android device connected.
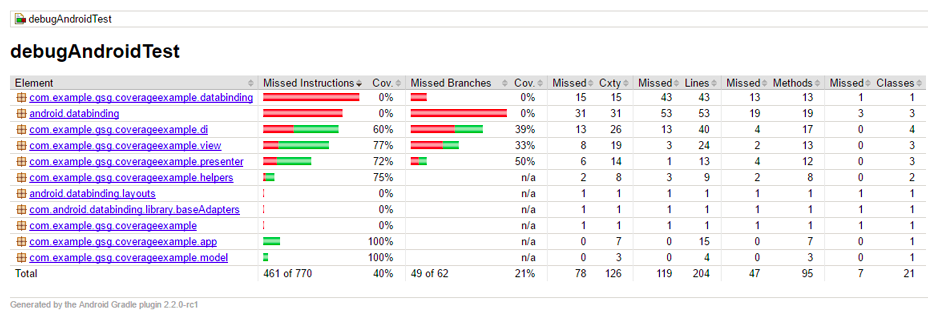
When Android Studio notifies you that everything is OK, you'll be able to find a test coverage report at “YOUR_PROJECT_PATH\app\build\reports\coverage\debug\index.html”:
Unifying Test Coverage Reports for Unit- and Android-Tests
Now when we have unit-, android- and robolectric-tests covered, we want to unify them in order to understand whether our test coverage meets project requirements as well as better analyze code quality. Unification can be achieved with two tools - Jacoco and SonarQube. Let's set them up in separate *.gradle files (jacoco.gradle and sonarqube.gradle accordingly) and connect them in our build.gradle file:
apply from: './fileName.gradle'
Also note that you need to add several lines to your app/build.gradle to enable test coverage measurement (I mentioned this above, remember?):

Jacoco is a free Java plugin that allows for basic creation of test reports.
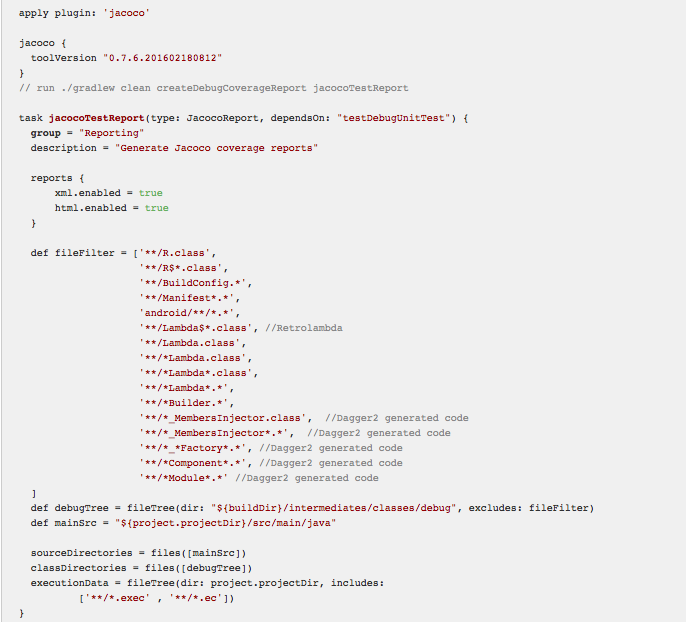
Now let's look inside:
- Add Jacoco plugin for gradle;
- Install Jacoco version;
- Create task that will run tests and unify their results
Task description in a nutshell: let's call it taskName, configure its type and tasks which it'll depend on (or which will depend on this task), indicate its group and provide a description.
Then define a filter, i.e. a list of files to be excluded from the analysis. In our case, it's a list of android-files generated, retrolambdas and Dagger files. We set up sourceDirectories and classDirectories and added fileFilter.
And now the most interesting part comes - let's create executionData from where we'll source data for unification: test coverage report for Unit tests is generated in *.exec file and stored at: YOUR_PROJECT_PATH\app\build\jacoco\*.exec
androidTest report is saved in *.ec file located at: YOUR_PROJECT_PATH\app\build\outputs\code-coverage\connected\**.ec
At this point we're able to generate a unified report. To do this, open your console and enter the following command:
./gradlew clean createDebugCoverageReport jacocoTestReport
Sequence of commands is very important: android-tests first, unit-tests second (enabled via testDebugUnitTests).
And that's it, we can now view a comprehensive test coverage report for android- and unit-tests. You can find it at: YOUR_PROJECT_PATH\app\build\reports\jacoco\jacocoTestReport\index.html
While it all seems cool, one feature concerned us a lot! I've told you before we added Robotolectric tests to our test coverage, remember? Now is the moment of their glory! It turns out that this type of tests is not included in any out-of-box coverage report! Yet, there's one remedy: add the following lines to your app/build.gradle file:

Now we're all set: we have a truly full test coverage report and all that's left to do is to relaunch a task.
However, we wanted to do more and see whether we could keep our entire code analysis including test coverage, style, quality, etc. in one hub. We decided to feed our test coverage report to sonarQube. To cut it short, launch sonarQube, install it and start up sonarQube server. Having installed sonarQube, you can now add a plethora of different plugins available for it. In our case we used the following plugins: Android, CheckStyle, FindBugs, Git, Java, XML. You can also create custom rules for your code analysis depending on your end goal and preferences. Once you're on friendly terms with sonarQube server, you can go back to your Android project and set up a sonarQube task:
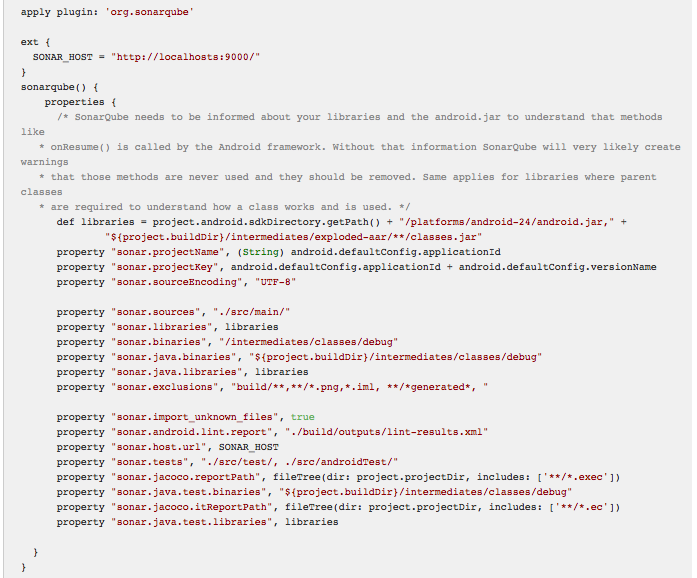
Clarification:
- Add gradle plugin;
- Add sonarQube-host to extension for convenience;
- Describe sonarQube settings (see examples)
In our case, pay attention to the following settings:
sonar.java.test.binariessonar.java.binariessonar.testssonar.jacoco.reportPathsonar.jacoco.itReportPath
Let's run: ./gradlew clean createDebugCoverageReport jacocoTestReport sonarqube
Now go to your sonarQube server, find your project there and analyze it:
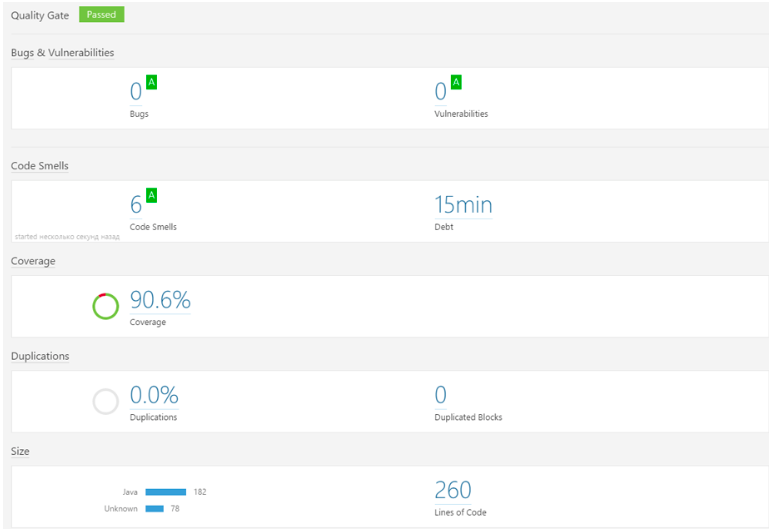
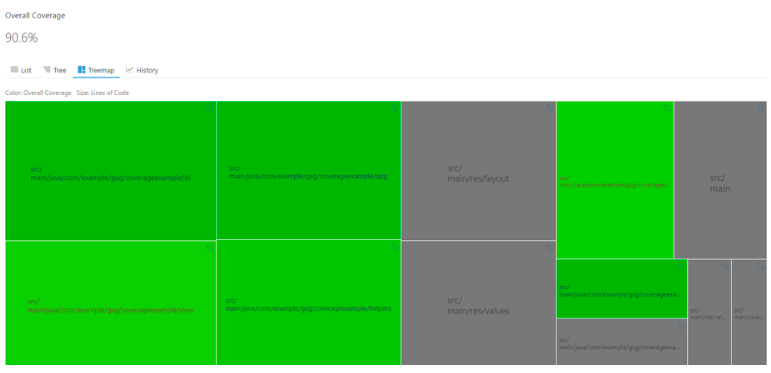
The project is available on BitBucket.
Images courtesy of dou.ua


